Key Takeaways from Q3 2024
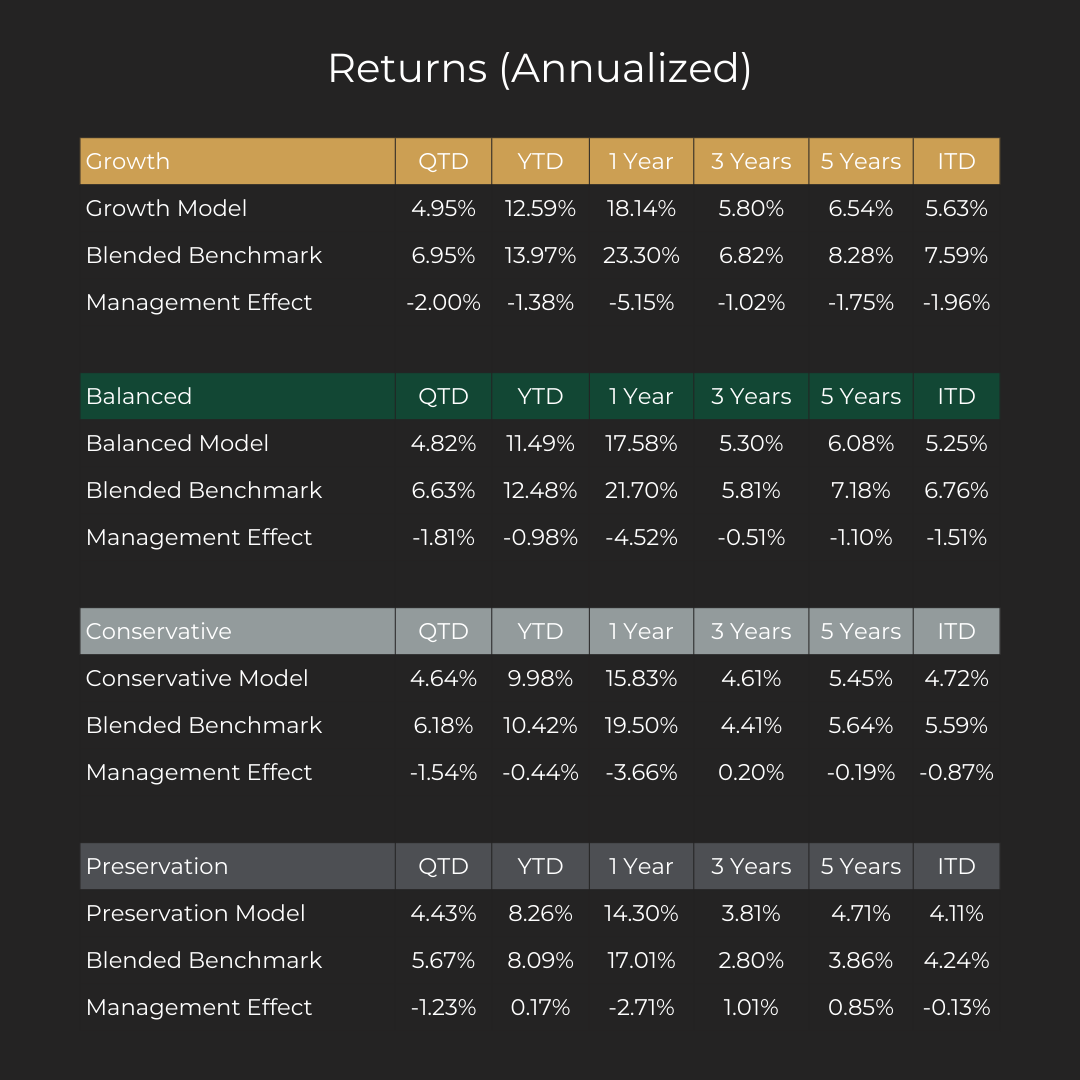
- Another positive quarter contributed to RWM’s Growth model, which wasup 20.77% over the last year. The Preservation model was up 14.5% for the same period. (As of October 15, 2024)
- Canadian stocks led the charge in Q3, driven by interest cuts from the Bank of Canada.
- The Federal Reserve cut its rate by 50 BPS for the first time in nearly half a decade; as inflation subsided and central bankers focused more on rising unemployment risks.
- Yield curves in both Canada and the US begin to normalize, and bonds rally.
- Chinese stock returned 22% in the month of September.
- Japanese stocks fell as the Yen soared. The Nikkei yo-yo’d through the quarter, leading to a massive global selloff in early August.
Market Overview
If Q1 and Q2 told a story that Canada and the US are now two very separate economies (as US large caps rose significantly relative to tepid Canadian securities), Q3 reminded us that the US and Canada are still very much linked. Restrictive monetary policy (interest rates) is restrictive policy no matter how you slice it; it can only last so long before cooling any economy. Inflation in Canada, as of the September reading, now sits at an annualized 1.6%, on the low end of the Bank of Canada target range. The stickiest area of inflation continues to be housing, which is actually driven by higher interest rates. In the US, CPI (inflation) is at 2.4% and is on a steep downward trajectory.
Canadian unemployment dropped slightly to 6.5% in September, surprising some pundits, but the trend over the last year has been a cooling jobs environment, with Canadian business managers indicating. Still, the trend over the last year has been a cooling jobs environment, with Canadian business managers indicating, surprising some pundits. Still, the trend over the last year has been a cooling jobs environment, with Canadian business managers indicating their hesitancy to invest in capital or human resources given the high interest rate environment. Meanwhile US unemployment has climbed to 4.10%, historically still low but trending upward. The Fed’s aggressive 50 bps point cut was a bit of a surprise, indicating that the Fed may be more concerned about the US economy than advertised and that current restrictive policy may be too strict for employment markets to bear. Chairman Jerome Powell indicated that the 50 bps (rather than a more traditional starting point of 25 bps) was a function of not cutting in the meeting prior and catching up to that mistake.
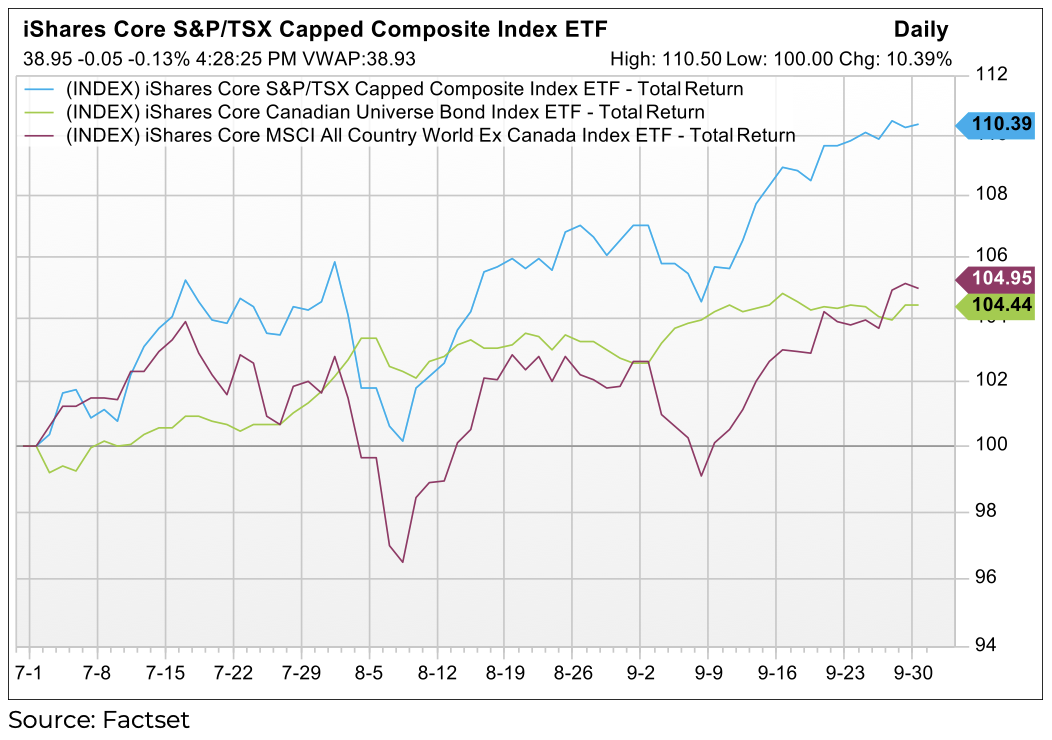
The third quarter of 2024 led to positive returns across the board for all major asset classes. Interest rate cuts across the globe continued the rally for stocks while also bringing bonds into the black for 2024. Breadth was wider than previously seen this year, with not just a few companies in the S&P 500 pushing markets higher but rather all major equity markets moving higher. Canada outperformed most markets, up over 10%, as shown in the Q3 chart below. Within that group, financials and commodity-linked equities saw the most appreciation.
Fixed Income
Canadian bonds struggled in Q1 and Q2 after their big rally in Q4 of last year but surged last quarter as traders saw a much clearer path to lower interest rates, especially for time periods 10 years or shorter. Many Portfolio Managers in Canada scrambled to add fixed income to their underweight funds in Q3, driving prices higher. The Canadian bond universe was up 4.44% in Q3. The Canadian Yield curve has moved from inverted to flatter to now upward sloping, at least on the long end, as we await further cuts on the short end. Many expect the short end of the curve to decline further. Whereas longer dated bond may have stickier yields.
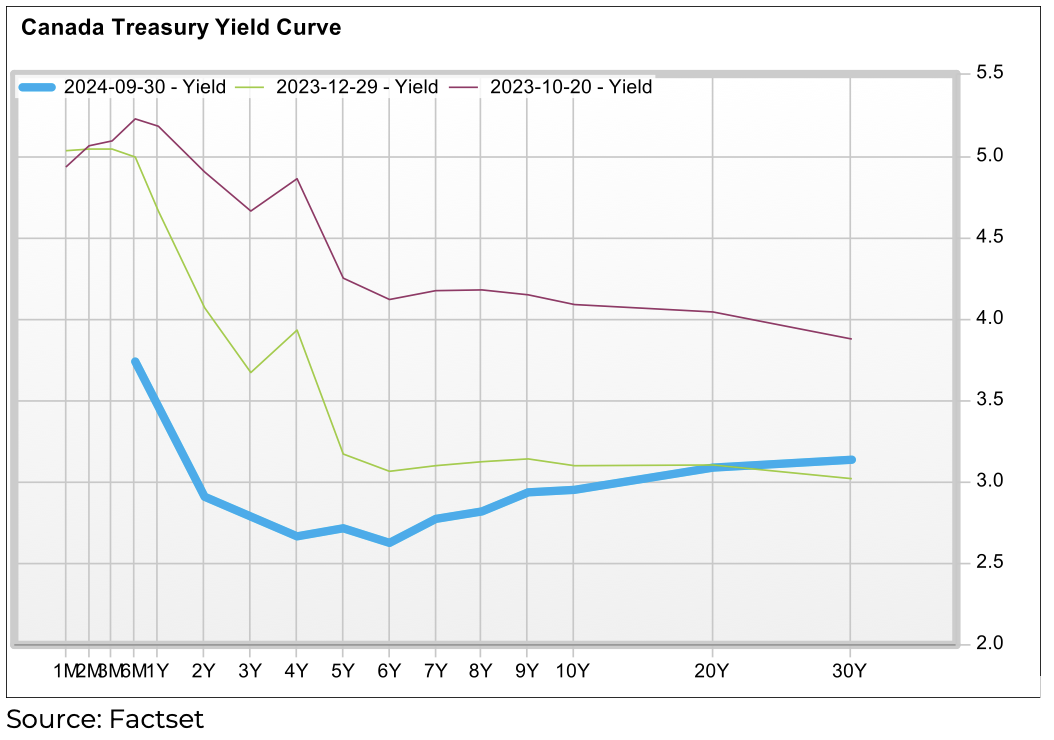
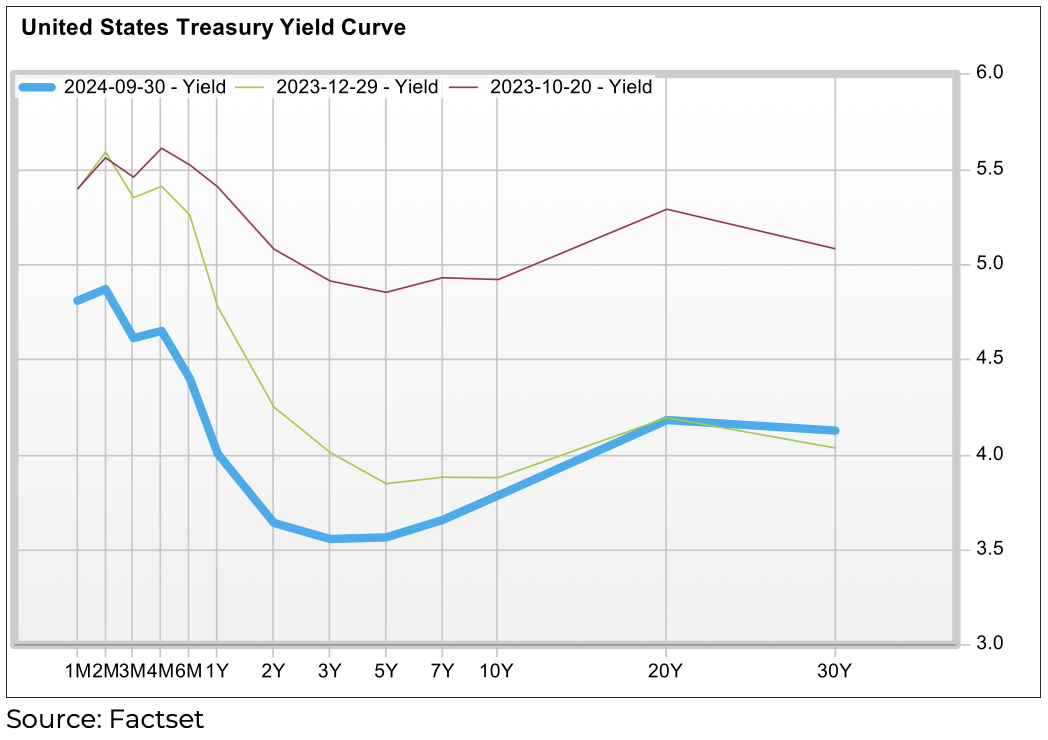
The US yield curve has seen less movement on the long end this year as a strong US dollar and better prospects for their economy have kept their rates higher across maturities relative to Canada. Additionally, the US’s need to continue to borrow excessively to service its high level of debt may keep the spread between Canada and the US treasuries wide for some time. Both countries have been running very large deficits compared to their GDP. In the case of the US this is surprising given how resilient the American economy has been.
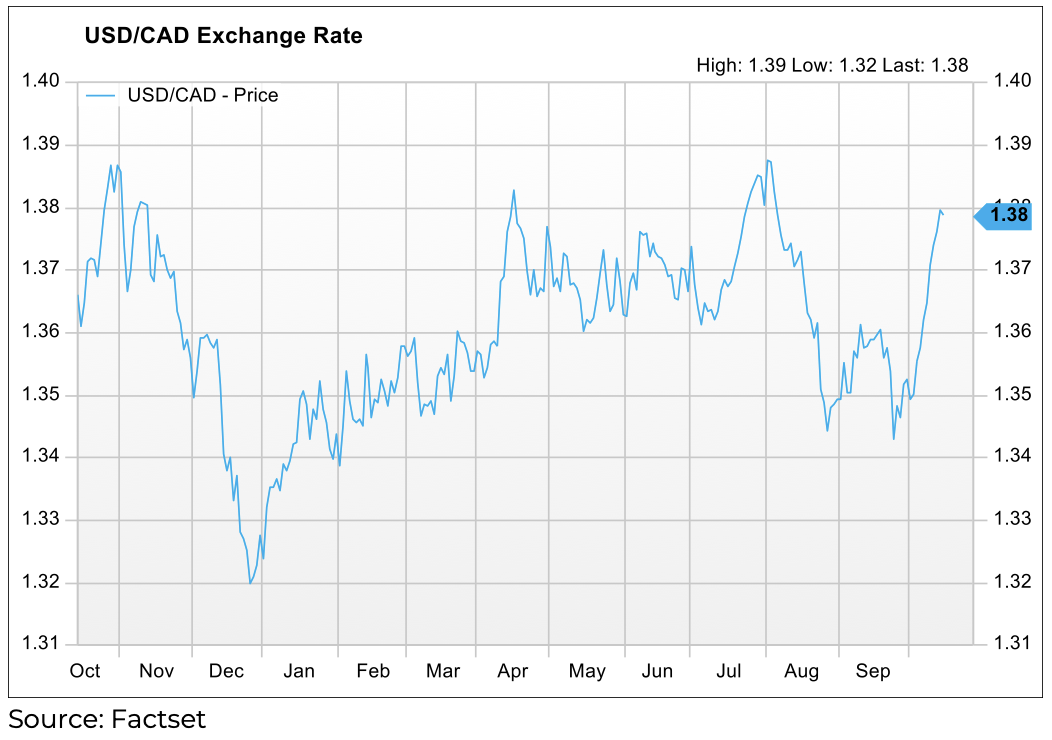
The USD/CAD currency pair had both a volatile quarter and 2024. Fears of higher US interest rates generating foreign investment demand away from Canada, and therefore Canadian dollars, have subsided as both countries have now lowered their overnight rate by 0.50% or more. The global reserve currency (USD) dropped to an important support level in August, successfully tested it again in September, and has since shot up near April highs.
Canadian Equities
In Q3, the Canadian stock market was a top performer in relation to global equity markets, returning 10.83% last quarter. This rally was led mostly by the Financial and Commodity sectors. The Bank of Canada lowered its overnight lending rate to 4.25%, the first step in easing financial conditions for both businesses and consumers, which should help bolster the economy and Canadian productivity.
US Equities
The S&P 500, which has led the charge in this bull market for the last year, had a total return in Canadian dollars of 4.4% last quarter. From an absolute return perspective, it was a great quarter, but comparably, it has been one of the worst-performing equity geographies and market cap sizes over the last few months. This is a very positive sign, as prolonged bull markets require renewed leadership. Moving away from the Mag 7 and the Artificial Intelligence-led rallies will most likely be needed to sustain continued quarters of high investment returns. Look for new leadership within small and medium market capitalization companies to push market higher over the coming quarters.
Twice, at the beginning of August and the beginning of September, equity markets experienced deep selloffs, and volatility spiked as a result. However, in both circumstances, the selloff was answered with an almost equally strong and quick recovery. This type of market behavior is good confirmation that we are still in a strong bull market, as many participants are still willing and waiting to buy the dips.
Global and Emerging Markets
International developed equity markets, which exclude North America, also had a strong quarter, up over 6% as a group. Returns would have been much higher if not for the negative contribution from Japanese equities due to the unwind of the popular Yen-Carry trade, which drove their stock market down -6% in Canadian dollar terms.
Emerging Markets had a good quarter, up 5.5%. This was mostly driven by the truly remarkable rally in Chinese equities. Chinese authorities finally eased financial conditions enough to spark a rally in their much-beaten-down stock market. The world’s second-largest economy saw its stock market gain over 20% in the month of September alone! The back drop is that Chinese equities were historically cheap (on a price to earning basis) driven by concerns about slower growth, shifting demographic and an anemic (and overbuilt) property market. Thailand and Hong Kong also benefited from this enthusiasm, both up over 20% in Q3.
Portfolio Attribution & Positioning
Growth Portfolio:
The Growth Model returned 4.95% this last quarter , slightly lagging its benchmark return of 6.95%. The positive performance was led mainly by a strong performance from our public equity allocations, particularly in Canada and Emerging markets. Our fixed-income and market-neutral positions also helped the positive performance. Our private credit and USD exposures were negative for the quarter remain positive for the year.
In Q3 2024, we made slight changes to the Growth Model as follows:
Increases:
- Long/Short
- Multi-Strategy
Decreases:
- Investment Grade Credit
- Cash
The Investment Committee made only minor changes to the Growth Model this quarter, as the consensus was that the portfolio is positioned quite well to continue to participate in the upside of the current bull market but also limits our exposure to the downside. We noted solid July run for small and mid-caps, but the rally did not sustain into August and September. Our team anticipates that if the equity bull market continues, this market sector should break out considerably. As asset prices and valuations continue to climb, we have and continue to focus more on limiting our downside participation in the event of a market correction.
Preservation Portfolio:
The Preservation Model was up 4.43% in Q3 compared to our benchmark of 5.67%. Fund returns were mostly generated from our high allocation to fixed income and equities, especially Canadian equities. Our real estate allocation also contributed, while some performance was lost due to a weaker US dollar and lagging (but still positive) performance from our absolute return strategies.
In Q3 2024, we made the following changes to the Preservation Model:
Increases:
- Credit
Decreases:
- International Equity
The Investment Committee continued adding additional credit to the preservation at the expense of international equity. We felt that bonds would benefit from changing BOC policy agendas and less restrictive financial conditions. Swapping some equity for a ,more significant credit allocation allows us to potentially generate higher returns while moving more conservatively across the risk spectrum.
Year-to-Date Performance & Outlook
Our year-to-date return for the Growth Model is 12.59%, compared to our benchmark of 13.97%. For the Preservation Model, the YTD return is 8.26%, compared to the benchmark return of 8.09%.
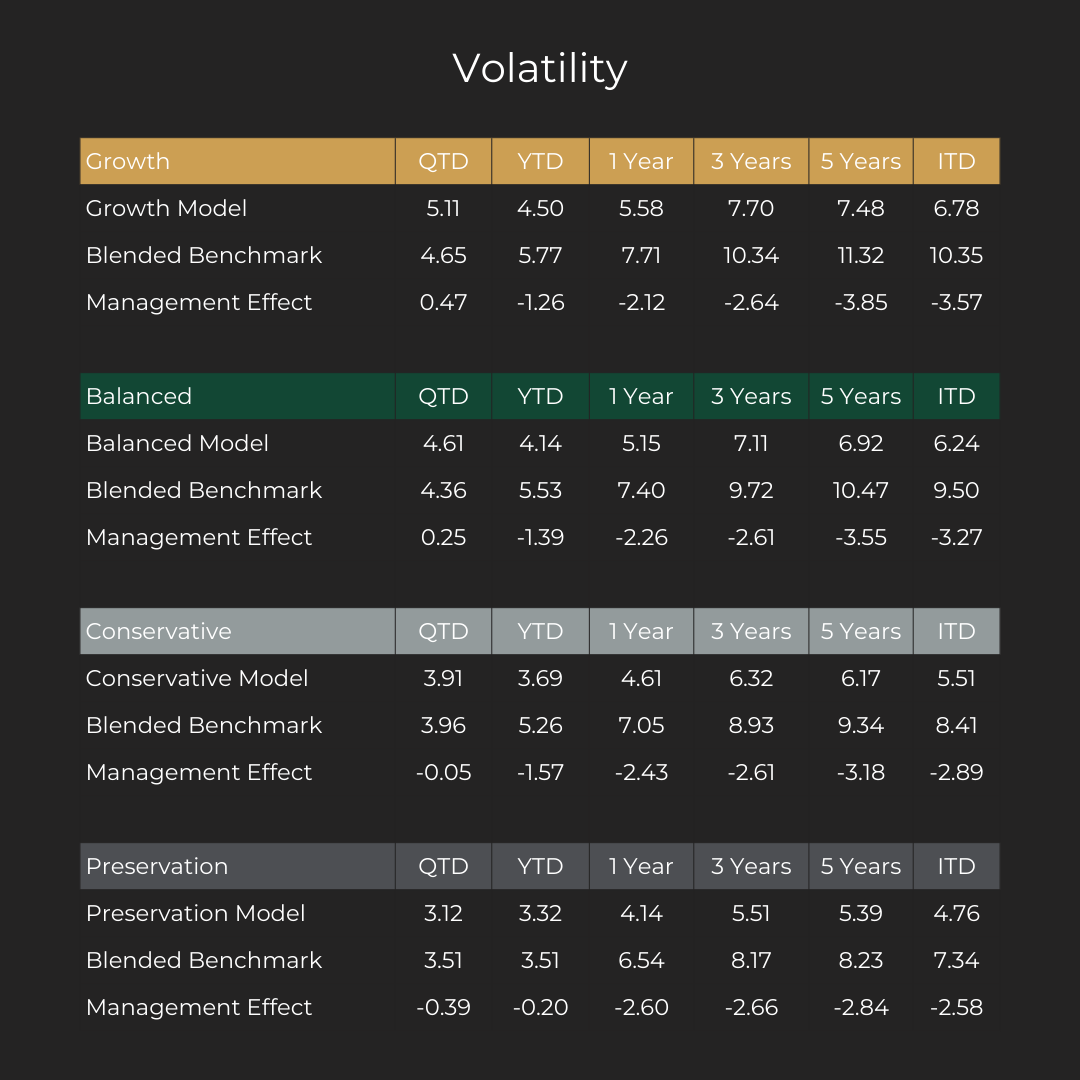
Our standard deviation (volatility) of returns over this quarter was 5.11% for the Growth fund and 4.61% for the Preservation fund;. However, our volatility for the quarter was above our benchmarks (primarily due to currency fluctuations), our funds’ Year-to-Date volatility remains below our benchmarks. We remain committed to providing our clients with the best risk-adjusted returns we can generate and the care their investment capital deserves.
Your account information has been updated in your client portal. As always, if you have questions, please contact your adviser or our client service team at rwmclientservices@raintreeWM.com.
As of September 30st 2024
