CEO Message
Commentary Highlights
- Inflation data in Canada gave the Bank of Canada enough confidence to finally lower its overnight lending rate from 5% to 4.75%.
- Inflation data in the US remains much stickier but is starting to show signs of slowing down. Current Federal Reserve rate cut projections are for only 1-2 rate cuts this year.
- Canadian Bonds were up nearly a percent this quarter but still negative on the year. While Canadian stocks had a negative quarter, they are still up 6% year-to-date.
- US Equity markets continue to be driven by the large tech companies with the most significant exposure to Artificial Intelligence, driving almost all of the market return.
Market Overview
The second quarter of 2024 saw US large-cap stocks continue their meteoric rise. The S&P 500 has risen 19% in the last six months. This index is increasingly being dominated by just a few stocks. The top 10 companies make up over 35% of the index’s weight and generate nearly 25% of the profits for the 500-member group. The market seems most focused on the impact of future interest rates and the implications of Artificial Intelligence. As a result, large tech companies continue to receive the most investor interest. Smaller-cap and traditional sector businesses, who likely will see some bottom-line benefits from AI one day, are still clouded with the ambiguity surrounding their ability to continue to service the growing cost of debt and, as a result, are receiving much less investor interest.
The Canadian and US economies continued diverging in Q2. Year-over-year inflation north of the border, 2.72% latest reading, cooled enough to warrant a rate cut for the first time in years. In contrast, higher US inflation data, 2.98%, still hasn’t reached a level that warrants any “dovish” (interest rate-reducing) monetary policy actions. Unemployment in Canada continues to climb at 6.4%, a level not seen since 2017. The most recent reading was that US unemployment was at 4.1%, certainly now trending upward but still at very healthy levels.
Fixed Income
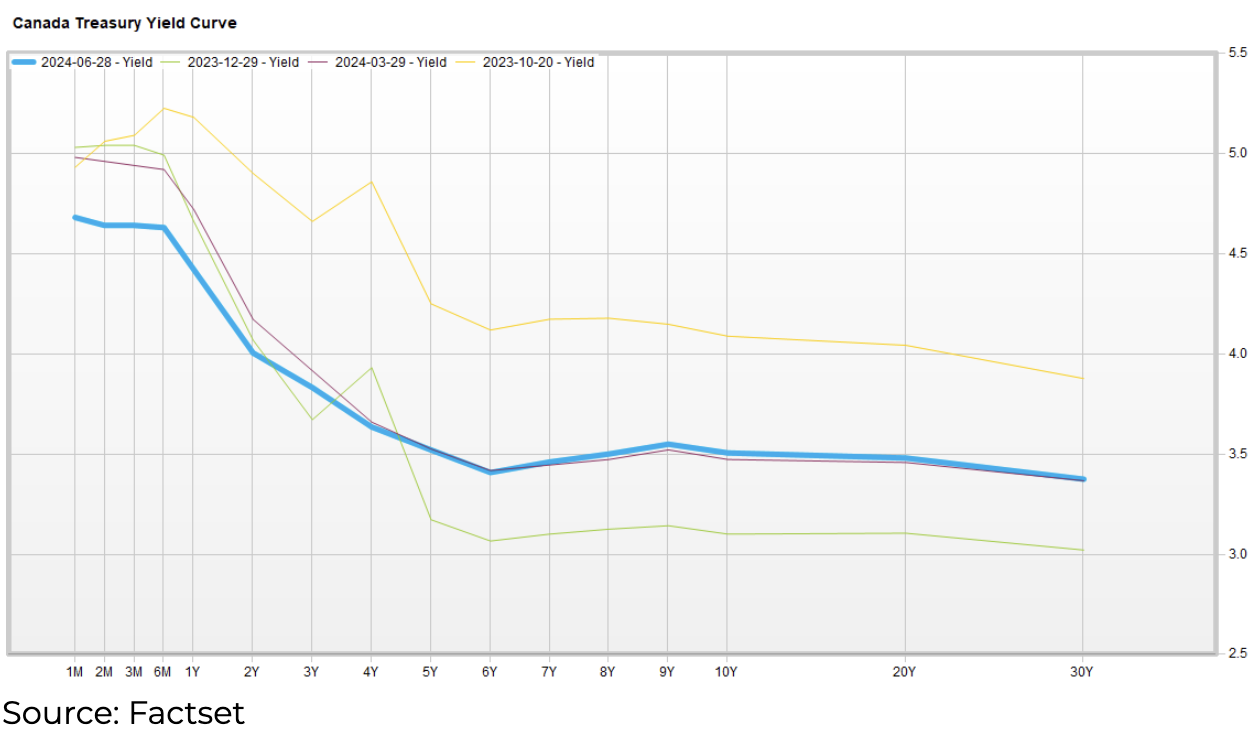
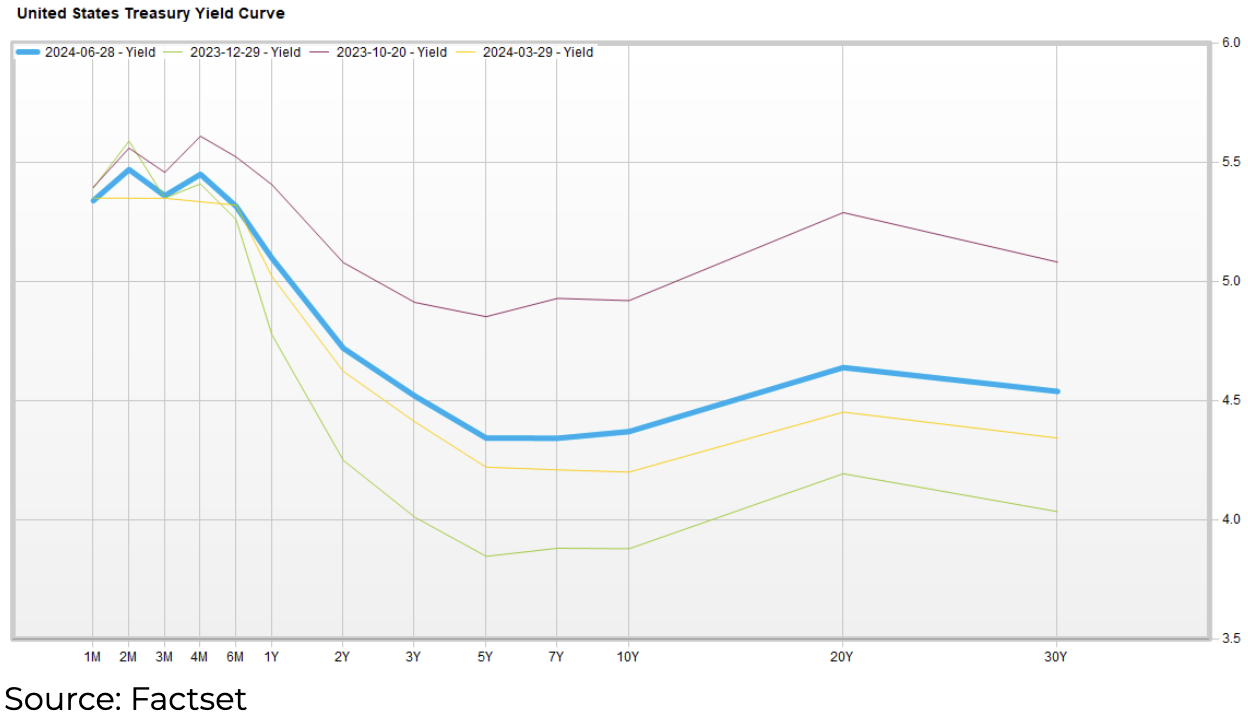
Canadian bond prices were mostly flat this quarter, which helped them generate a total return of nearly 1% in interest. Notably, the shorter end of the curve came down in the quarter, reflecting the market’s expectation that there would be more overnight rate cuts to come. The charts below depict the recent shape-shifting of the US and Canadian Treasury Yield curves.


The US yield curve moved back up this quarter, while the Canadian yield curve remained about the same in Q2, minus a drop on the short end from the BOC’s rate cut decision. The net result is a further widening between Canadian and US interest rate spreads. We are paying close attention to this gap (and other global spreads); if it gets too wide and persists for a long enough time, it could have a material impact on the Canadian/US currency pair in the form of a weaker Canadian dollar. If we continue to cut rates in Canada and the US does not, these treasury spreads will widen. Or, if demand for US Treasuries can’t match the high supply needed to service US debt, these treasury spreads will widen. Higher interest rates tend to attract capital if the markets are deemed to be the same or similar in riskiness.
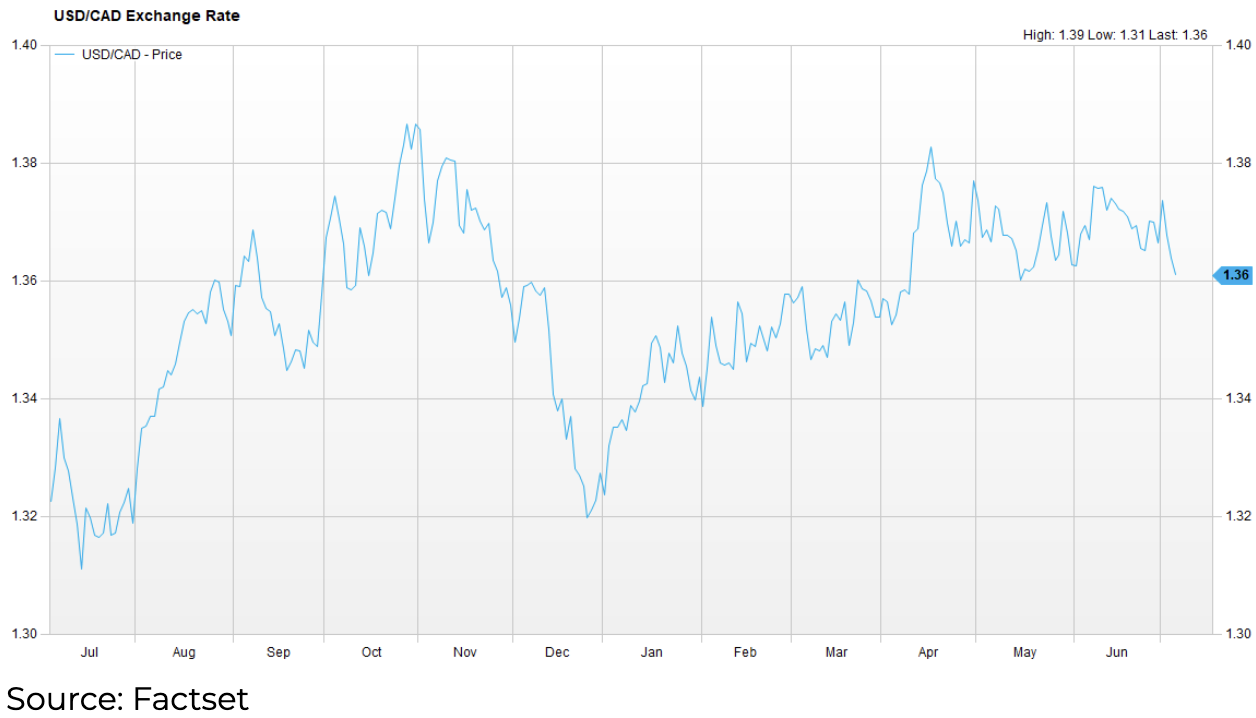
As illustrated in the chart below, the USD/CAD currency pair has come off its April highs and is trading at the bottom of its Q2 range, perhaps indicating that the market predicts our two central bank policies won’t remain too different for too long. Recent US inflation data has shown improvement, suggesting that the Fed may start cutting rates, seeking that elusive “smooth landing.”

Canadian Equities
Canadian stocks measured by the TSX Index had a negative total return in Q2 2024 but are still up 6 percent. Higher unemployment, lower corporate earnings, muted GDP growth, household debt levels, and the rise in bankruptcies indicate a future in the Canadian economy without government intervention and/or central bank relief. Further government stimulus seems off the table, given the already alarming deficits the federal government is running. With the risk-free interest rate still at a very attractive 4.75%, the Canadian equity risk premiums may be a bit high for our economic prospects, especially for would-be foreign investors who have to take on our currency risk.
US Equities
US stocks measured by the S&P 500 returned over 5% last quarter, pushing their yearly returns to over 17% in Canadian dollar terms. This demonstrates that buyers are still willing to pay up for equities if they’re the right stocks in the right country. These bulls have pushed chips/graphic card maker Nvidia Corporation’s market cap to 3.161 trillion USD, more than all of Canada’s stock values combined. Many market pundits are concerned that the valuations of Nvidia and other tech giants are being driven by the Fear of Missing Out (FOMO). The S&P 500, excluding the Magnificent 7, is close to flat year to date.
Global and Emerging Markets
The action observed in the Emerging Market was quite volatile this quarter, but as a market-weighted group, it did quite well, returning over 6%. China led the way, up roughly 10%, India up 9%, and Taiwan up 13% (mostly from one semiconductor company). Brazil and Mexico saw considerable selling pressure, down 12% and 17%, respectively.
The more developed parts of the world saw modest total equity returns of 2%. Europe was flat in the quarter. Like Canada, many European markets show signs of tapering inflation and are heading towards a lower interest rate environment. Elections in the UK and France have also been at the top of investors’ minds.
On the other side of the world, Japan is experiencing a continued major currency devaluation. Their equity market was down by 3% in Canadian dollar terms. If you strip out their currency depreciation against the Loonie during the quarter, their equities were up by over 5%. Japan’s low-interest policies have significantly impaired its currency relative to other countries.
Portfolio Attribution & Positioning
Growth Portfolio:
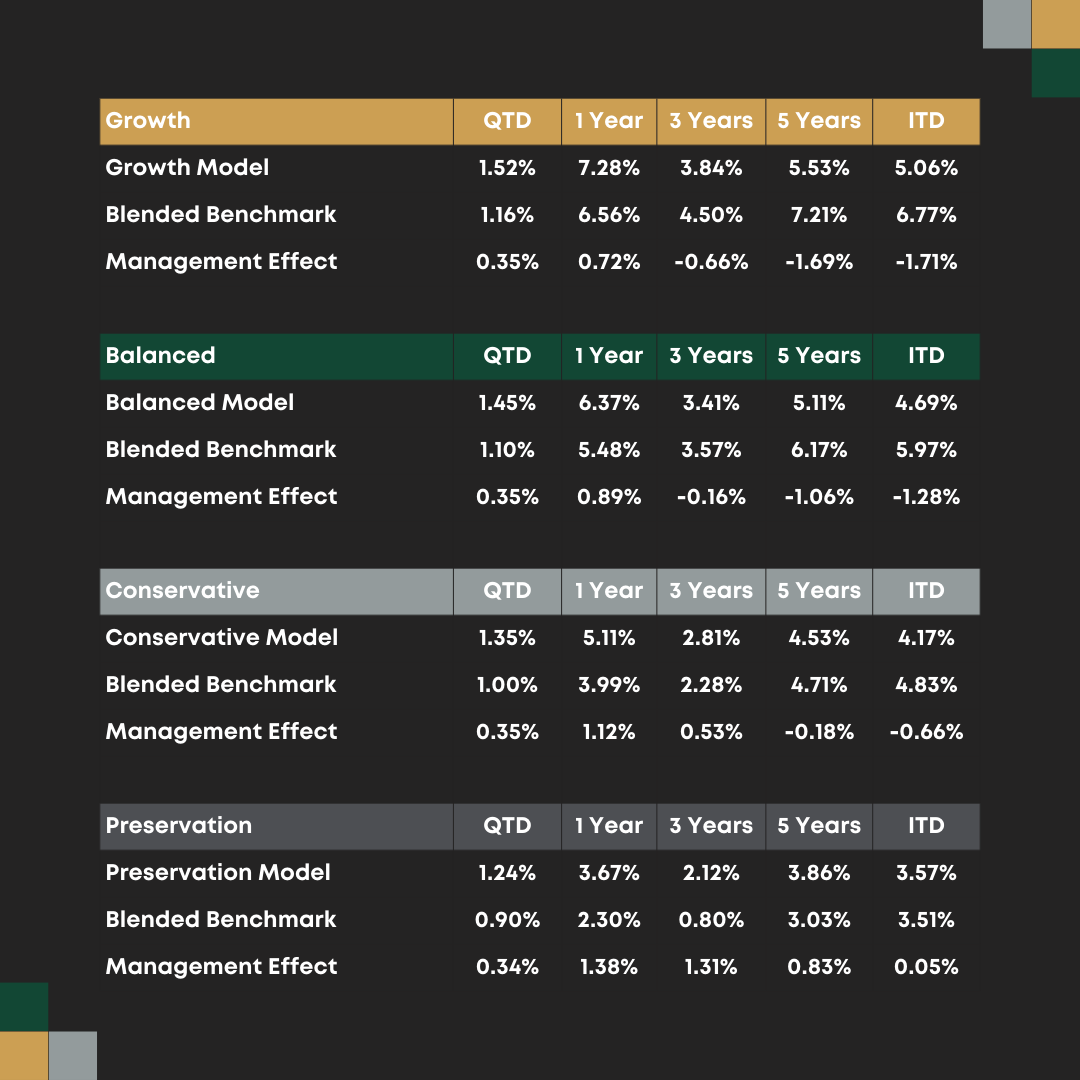
The Growth fund returned 1.52% vs. its benchmark return of 1.16%. The positive performance was driven by our allocation to public equity, specifically US large caps, private credit, and Emerging Market equities. Our absolute return strategies also played a role in beating our benchmark. Canadian Equity and our exposure to US dollars were both negative contributors to the quarter.
In Q2 2024, we made the following changes to the Growth Fund.
Increases:
- Long/Short
- Multi-Strategy
- Canadian Equity
- Long Duration Bonds
- Corporate Bonds
Decreases:
- US Large Cap Equities
- Public Real Estate
- Canadian Small Cap Equities
- US Small Cap Equities
- Cash
This last quarter, our Investment Committee became more confident that the Bank of Canada would cut its overnight interest rate. We decided the best course for the Growth fund would be to add more interest rate exposure at the expense of some equity and real estate.
Although the growth fund has outperformed its benchmark on the upside this year, which we are obviously happy about, we still strongly believe the fund is positioned well to limit downside risk should there be a market correction. We still believe that limiting downside participation is the best way to maximize total returns in the long run.
Preservation Portfolio:
The Preservation fund was up 1.24%% in Q2 vs our benchmark of 0.90%. The quarter’s positive performance mainly came from our allocation to bonds and absolute return strategies. We feel these strategies will continue to perform well into the foreseeable future.
In Q2 2024, we made the following changes to the Preservation Fund:
Increases:
- Emerging Markets ETF
- Corporate Bonds
- Government Bonds
- Multi-Strategy
Decreases:
- Short Term Bonds
- Long Duration Bonds
The Investment Committee added equity exposure to the Preservation Fund. It modified the duration and credit exposure to the fixed-income portion of the fund, increasing our exposure to longer-dated bonds. This decision is designed to help increase interest rate sensitivity, which should improve the return potential if interest rates continue to fall.
Year-to-Date Performance & Outlook
Our year-to-date return for the Growth fund is 7.28%, compared to our benchmark of 6.56%. For the Preservation fund, it is 3.67%, compared to the benchmark return of 2.30%.
Our standard deviation (volatility) of returns over this quarter was 4.17% for the Growth fund and 3.77% for the Preservation fund; this continues to be well below our benchmark’s volatility. This is the second quarter in which we have outperformed our benchmark while taking on far less volatility risk.
We remain committed to providing our clients with the best risk-adjusted returns we can generate and the care their investment capital deserves.
Your account information has been updated in your client portal. As always, if you have questions, please reach out to your adviser or contact our client service team at rwmclientservices@raintreeWM.com.
As of June 30, 2024

