Commentary Highlights
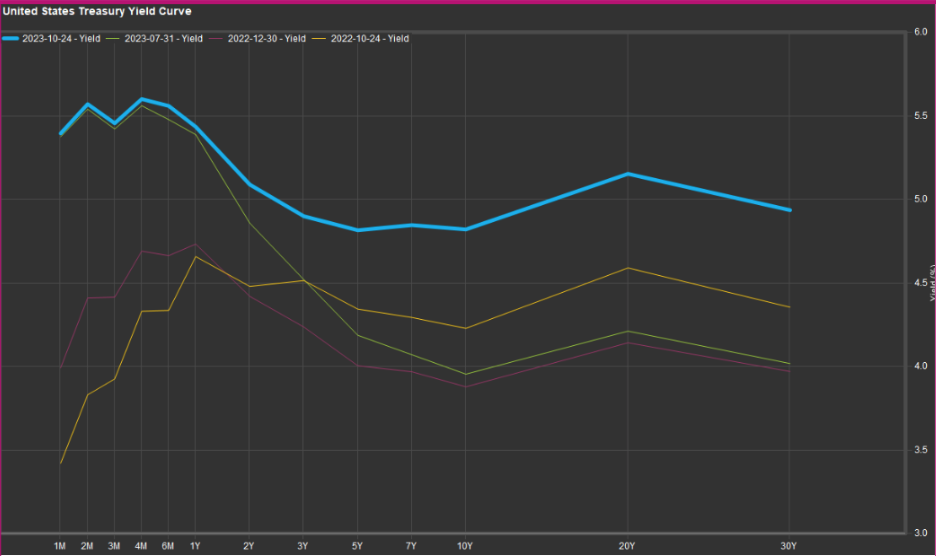
- The environment in the last quarter was challenging for fixed income (bonds). Treasuries in Canada and the US were pummelled as longer-term yields rose quickly.
- The S&P 500 and TSX indexes retreated significantly in September, driven mainly by investors taking a risk-off position.
- Energy prices escalated in the quarter dramatically, with the WTI oil price up 25.8%.
- Jobs and wage growth continue to dominate the headlines, making decisions about the overnight rate more difficult for Central Bankers.
- Volatility picked up in the latter half of the quarter as the market accepted a “higher for longer” narrative.
Market Overview
The market was tranquil during the summer, with much speculation that the Fed would steer the economy to a soft landing. That tranquility gave way to volatility investors, especially those in the fixed-income market, who started to get concerned about fiscal spending in the US. This was followed by a downgrade by Fitch Ratings of the US credit rating, a standoff relating to the debt ceiling, and yields driving bond prices in one of the worst routes since the early 80s. Notwithstanding the perilous drop in bond values, the stock market and mainly the S&P 500 has been relatively resilient; despite consecutive down months, it is still up 13% to the end of September.
In Canada, inflation rose to the upside in August, leading more economists to speculate about another rate hike. GDP growth was near zero during the quarter, with several economists believing that rate hikes have started to take effect in slowing down the economy, particularly consumer spending. In September, inflation numbers eased slightly in Canada. The trajectory of CPI is trending in the right direction to bring inflation closer to the target.
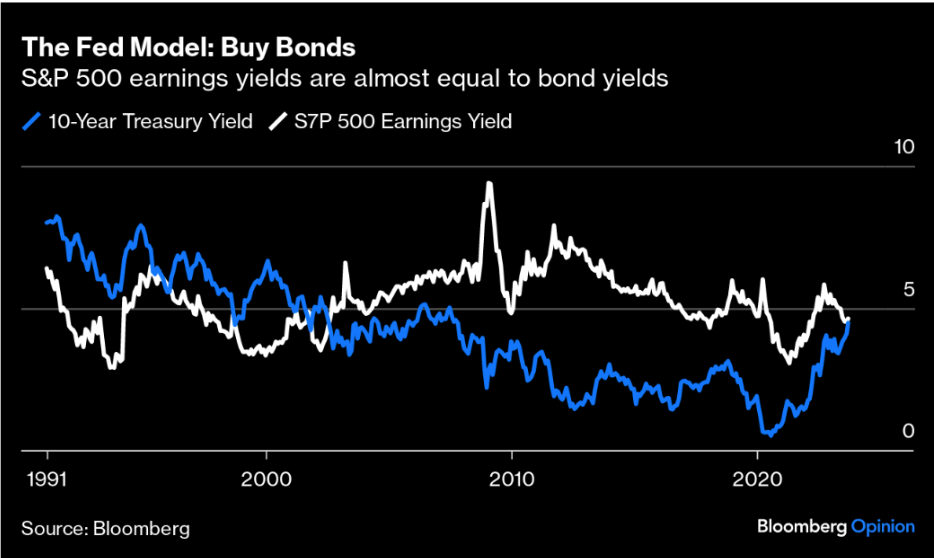
Overall, the market is weighing trade-offs. Is it better to take short-term rates with little exposure to duration risk in longer-term bonds, or have we seen the top of long-term yields with the possibility that you can earn capital gains if interest rates descend? Is it better to take a government treasury yield with a certain return or buy stocks at a similar implied earnings yield with the prospect of more volatility (and a reduction in the safety of those future earnings)? The following chart shows the 10-year Treasury Yield crossing the earnings yield for the S&P 500. Some would suggest that taking the certain interest coupon of the US government may be a better trade-off. Certainly, it’s worth considering.

Canadian Equities
The Canadian equity market struggled to remain positive in Q3 2023, as an inflation-feared equity sell-off at the end of September had the S&P/TSX Composite Index finishing down for the quarter. Solid performances in the energy sector were not enough to offset the drag from both the financials and technology sector. The Canadian economy continued to recover from pandemic-induced challenges, though signs of trouble include GDP per capita declining for 12 straight months and signs of consumer credit stress.
US Equities
At first glance, US equities had a solid first half of the year, with overall markets rebounding sharply from their 2022 selloff. However, the S&P 493, the S&P 500 minus the seven largest companies based on market cap, is flat yearly. This is likely explained by a flee to safety into these Mega cap stocks, given their strong balance sheets, recurring revenue, and ability to withstand a higher interest rate environment.
Fixed Income

Global and Emerging Markets
International equities experienced mixed performance in Q3 2023. While European markets faced headwinds due to concerns over inflation and geopolitical uncertainties, emerging markets in Asia and Latin America showed more promising signs. The MSCI EAFE Index, representing developed international markets, witnessed modest gains, reflecting the cautious optimism prevailing in the global economy.
Emerging markets displayed notable resilience in Q3 2023. Strong economic growth, particularly in Asian economies and accommodative monetary policies, contributed to positive market sentiment. The MSCI Emerging Markets Index recorded solid gains, with technology, e-commerce, and renewable energy sectors leading the charge. The Chinese equity market started to show signs of life as the government poured additional stimulus into the economy to drive growth.
Portfolio Attribution & Positioning
Growth Portfolio:
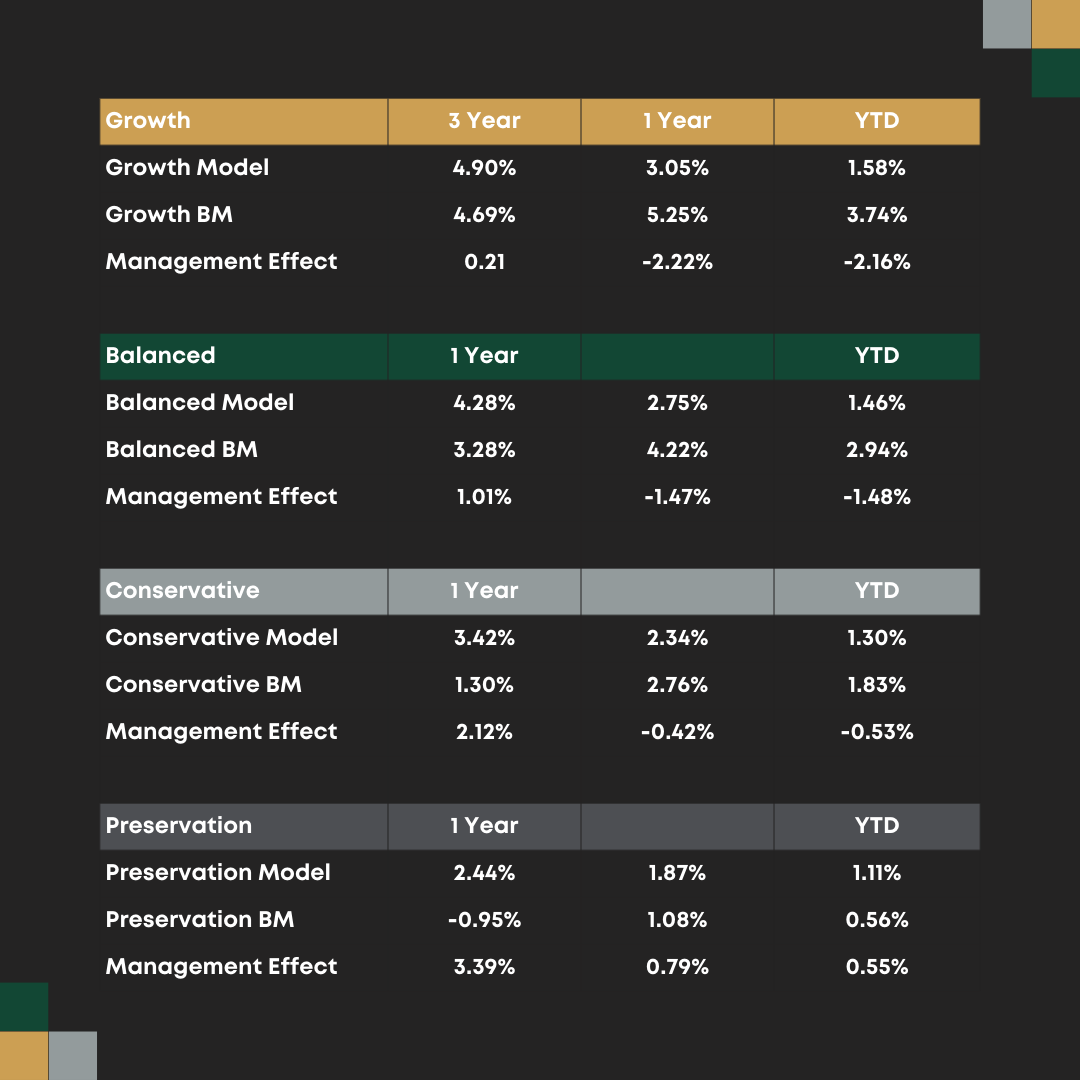
This quarter saw substantial losses in most major security markets. Continued upward pressure on yields had investors selling both stocks and bonds in September while adding to their cash positions. The Growth Fund was able to offset some of these losses with gains in Canadian small-cap equities, short-term bonds, global equities, and our more market-neutral multi-strategy allocation. This netted a quarterly performance of -1.26% compared to our benchmark return of -1.91%.
In September, we made the following changes to the Growth Portfolio:
- Increases:
- Private Credit
- Long/Short
- Multi-strategy
- Cash
- Decreases:
- Canadian Equity
- US Equity
- International Equity
- Emerging Market Equity
- Canadian Fixed Income
- Canadian Preferred Shares
The above allocation changes in our Growth Fund reflect our view that as Fixed Income yields rise, the risk/reward relationship in owning equities worsens. Current yields indicate that, in general, equities are not offering enough of a risk premium to justify our usual portfolio weight. Given the uncertainty regarding the direction of future interest rate movements, we have created a private credit allocation in our growth fund to lower that risk. The private credit strategy lends and borrows on a floating rate system, which aids in , avoiding duration risk, and at the same time providing a premium return expected to exceed 10%. We have also increased our market-neutral allocations, our Long/Short Fund and Multi-Strategy Fund, and are holding more cash within our money market fund, PSA, which offers a very attractive risk-free return. We anticipate reallocating to our more directional allocations when we see clearer economic data and financial asset values that better reflect those macroeconomic conditions.
Preservation Portfolio:
This quarter, our Preservation Portfolio was down -1.48% compared to its benchmark return of -2.67%. This relative outperformance can be mainly attributed to our decision to hold more cash in the form of High Interest Savings Fund, which is generating over 5%, and our increased allocation to Short-Term bonds.
The Investment Committee remains cautious given the current volatility seen within Fixed Income markets. At the same time, we are becoming increasingly optimistic about the future of fixed income as the entry point at these interest rates is looking more appealing that any time in the last 15 years. The preservation fund will be well-suited to exploit these opportunities once volatility subsides.
In September, we made the following changes to the Preservation Portfolio:
- Increases:
- Cash
- Short-term Bonds
- Decreases:
- International Equities
- Corporate Bonds
- Emerging Markets
- ETF Growth
- Preferred Shares
The above changes reflect the Investment Committee’s views that, at present, fixed income has a higher risk-adjusted return potential than equities. Recent volatility in markets suggests uncertainty and, therefore, added market risk. The overnight rates make holding cash a very attractive option while we wait for market uncertainty to subside. We also believe that many of these financial and economic uncertainties will become clearer in the coming quarters, and we will adjust accordingly.
Performance
The RWM portfolios have generated positive returns over the last nine months. Given the substantial sell-off in fixed income and most global equities experiencing negative returns this year, we are satisfied with our year-to-date results. More importantly, we are optimistic about how our funds are set up to take advantage of future financial conditions. We are also pleased with the amount of risk we’ve taken to attain these results, indicated in our low volatility and max drawdown data.
Our benchmarks are heavily influenced by movements of the S&P 500, which is increasingly more and more weighted towards just seven companies in the US with massive market capitalizations. Their outperformance this year is unprecedented; they have rallied to the point where their average Earnings Per Share is over 45, more than double the valuation of the other 493 companies in the S&P 500. Put another way, the S&P 500 is up 11.3% this year, while the S&P 493 is negative. Our funds only hold 2 of these 7 Mega cap stocks, the main reason for our benchmark underperformance this year. Given the implied discount rate as longer-term yields rise suggests to us that these valuations are unsustainable as growth companies are priced based on their earnings well into the future, we do not believe there is much upside opportunity in holding these seemingly overvalued stocks. Three-year performance exceeds benchmark performance across all of our investment mandates.

