CEO Message
Commentary Highlights
- Inflation data on both sides of the border showed material improvement attributable to this even longer-than-normal period of tighter financial conditions driven by interest rates.
- Fixed income (bonds) rallied significantly in the 4th quarter as the Federal Reserve changed its stance from hawkish to slightly more dovish.
- As for Equities (stocks), the S&P 500 and TSX indexes rose rapidly through November and December, driven by a shift in market expectations for lower rates coming as soon as spring 2024.
- Energy prices saw a reversal in the 4th quarter on negative concerns over the supply and demand sides of the market.
- In aggregate, job data and wage growth show signs of improvement, but the positive stats remain sector-dependent.
Market Overview
The 4th quarter of 2023 saw a drastic change in market sentiment, almost turning on a dime on October 18th after being quite bearish for the preceding quarter. Positive inflation data led to speculation in November that the central banks would cut rates sooner than expected. The Federal Reserve heavily boosted this speculation in December by coupling a decision not to raise rates with a dovish public address that suggested they were done with raising rates and that financial conditions were “well into restrictive territory.”
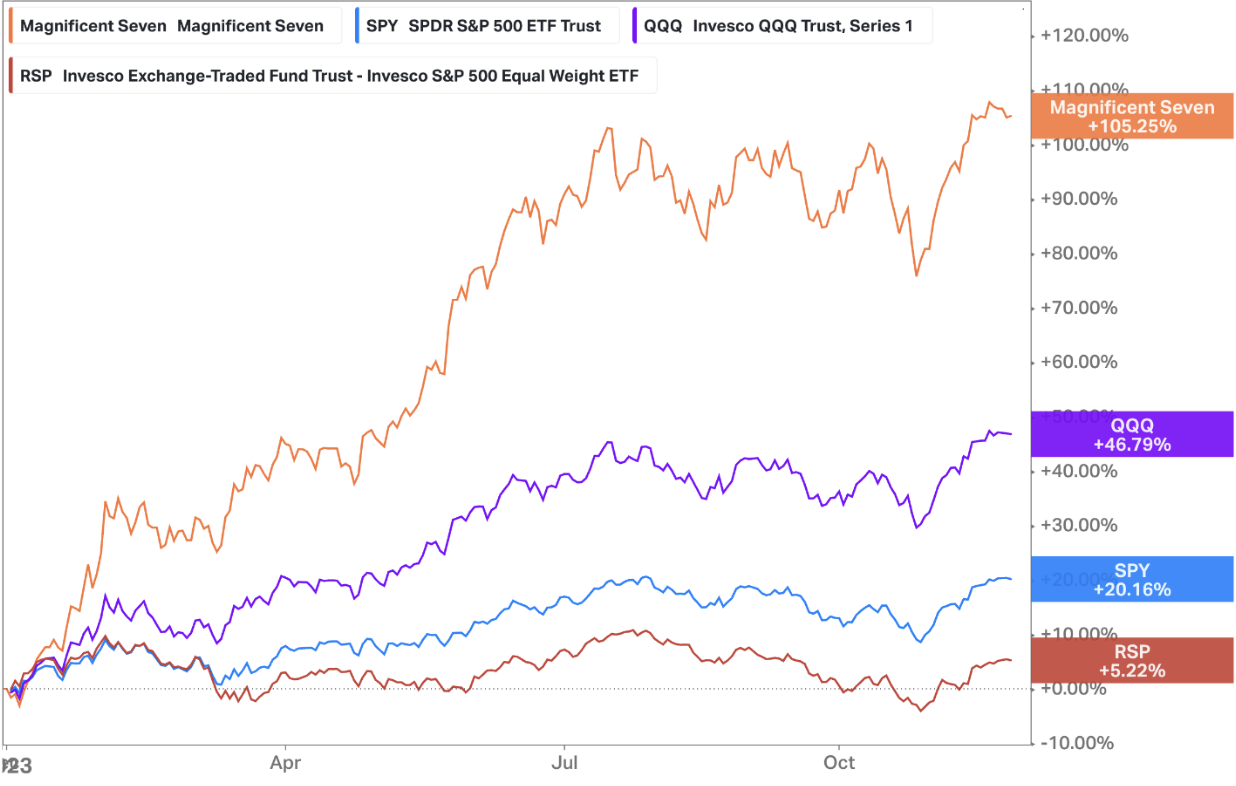
Given the recent US GDP print of over 5%, market participants made heavy bets that rate cuts this year would yield a soft or no landing for the US economy in 2024. As a result, all major asset classes rallied into the new year, with bond markets experiencing the best 2-month return in history. Stocks finished the year on a 9-week consecutive week win streak, this time led by the more beaten-up names instead of just the “Magnificent 7” (Nvdia, Apple, Tesla, Google, Microsoft, Amazon, Meta). The Magnificent 7, representing 1.4% of the stocks on the S&P 500, drove 75% of the total increase in value of the index. However, the gap between the Magnificent 7 and the other 493 stocks of the S&P500 remains historically very high.
2023 Returns from Mag 7, QQQ (Nasdaq 100), SPY (S&P500) and RSP (Equal weight S&P500)
In Canada, inflation data also saw a considerable improvement. On a 3-month annualized basis, CPI-trim and CPI-median, the Bank of Canada’s (BoC) preferred core measurements, are now at 2.3% and 2.6%, respectively. As a result, the BoC decided to leave the overnight rate at 5%, still not promising that further rate increases are off the table. Tiff Maclem, the BoC chair, has been decidedly more hawkish than his American counterpart. The Canadian economy is undoubtedly slowing down, indicated by no growth in GDP over the quarter (and negative growth on a per capita basis). Still, sticky wage inflation remains a concern for central bankers. The outlook for Canadian households is constrained by debt loads, the highest in the G7, with the MNP Consumer Debt Index (a gauge of borrower sentiment) dropping to its lowest level ever.
As for the 2024 outlook, fewer predictions have been made, probably due to how wrong the economists/investment guru’s 2023 predictions heading into last year ended up being. There does seem to be a consensus that most markets will appreciate, but a much more moderate clip and with much more breadth.
Canadian Equities
It was a tepid year in the Canadian Equity markets. In Q4, Canadian stocks rallied with almost the same breadth and as seen in the US, despite oil being down, a 3rd consecutive month of no economic growth as, and a comparatively less dovish tone from the BoC. Proof the market remains mainly focused on interest rates and is making its predictions based on the economic data. The TSX/SPX composite closed out the year by over 8%, all these gains being generated in the last few weeks of the year. Interestingly, Canada had only one Initial Public Offering (IPO), making it the worst year on record and the worst IPO market globally.
US Equities
US stocks also rallied over 8% in the 4th quarter, which was remarkable given the index was already having a solid year. In 2023, the S&P 500 was up 24%, the Dow Jones was up more than 13%, and the Nasdaq 100 was up 43%. The vast majority of the superior returns in the US came from the “Magnificent 7” stocks, which now have a combined market cap larger than the Canadian, UK, and Japanese equity markets combined. As a result, market capitalization-weighted equity indexes here and around the globe will now have to depend heavily on the success of these extraordinary but arguably very expensive 7 companies.
Fixed Income
The bond market saw a rally not seen in, well, forever. Yields on both sides of the border came crashing down in Q4 because of the same positive inflation data and fed speak that boosted all major asset classes. Rate traders repositioned their bets on when rates will be cut, fixed income short sellers were forced to cover, and movement along the yield curve showed that the short end of the curve was where bond investors wanted to be to take advantage of the likely 2024 fed rate cuts while still getting paid a near risk-free 4%. Here’s a look at the new US and Canadian Yield Curves.
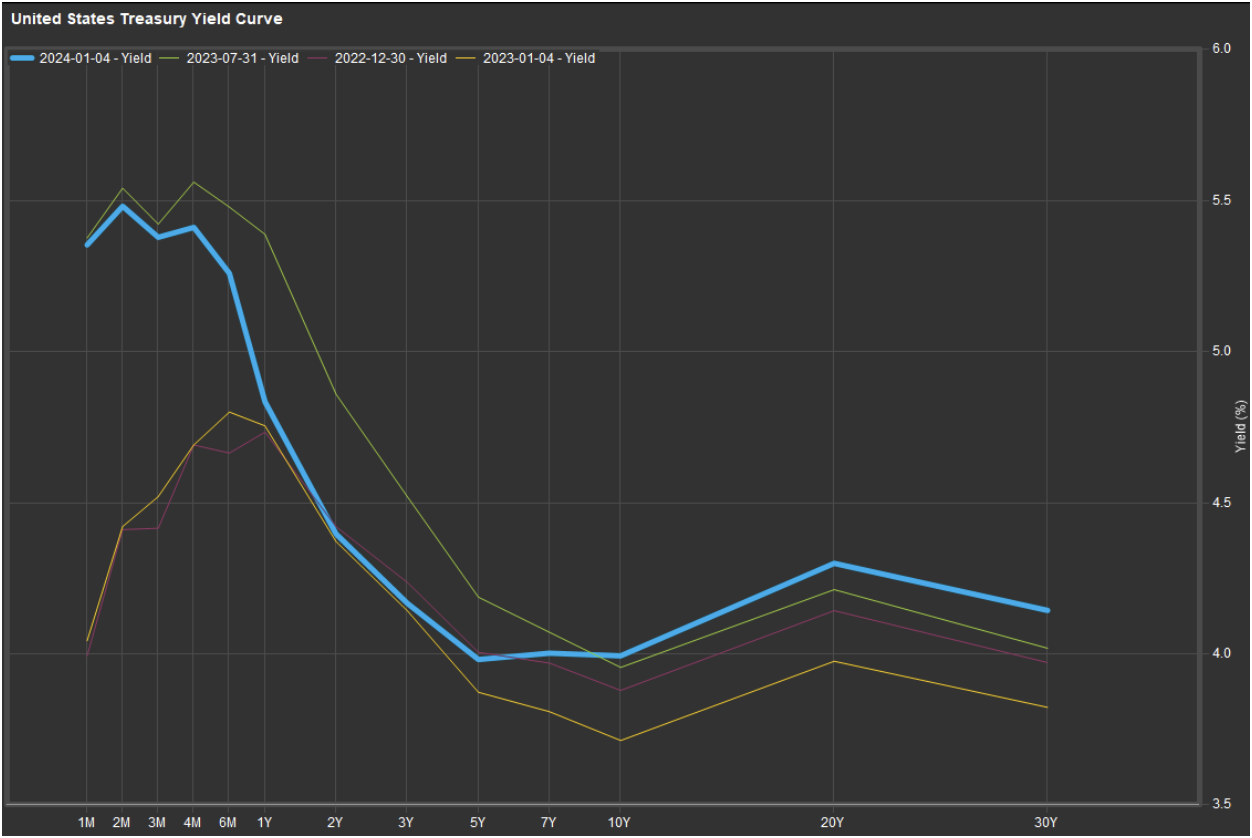
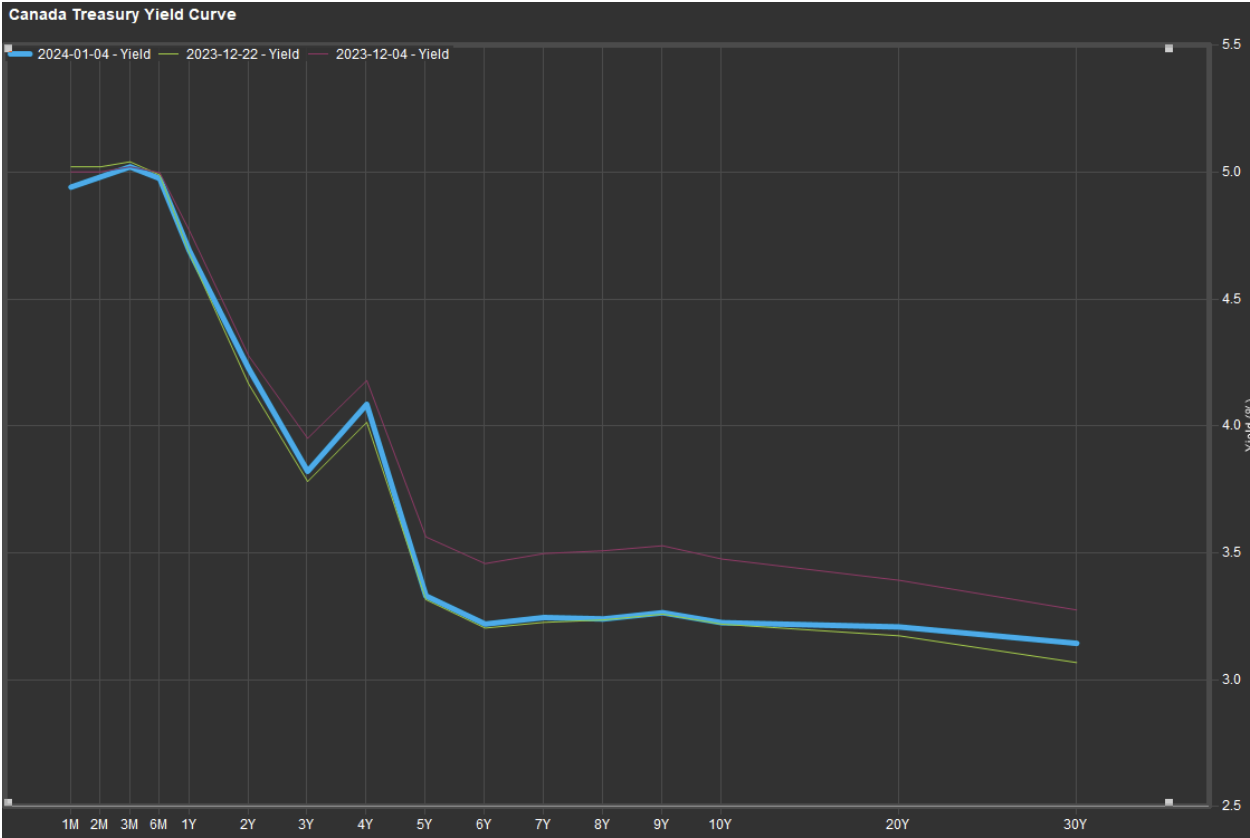
As you can see, the shorter-term rates sank significantly in both the US and Canada as traders expect rate cuts to impact short-term yields. In contrast, long-term rates are inverted, leaving market participants to flag this as a recessionary indicator. The market remains hungry for every data point that helps predict when central bankers will begin to cut rates. That is data concerning core inflation, jobs, employment, and wage growth.
Global and Emerging Markets
Europe and the UK are showing signs of slowing inflation, but the European Central Bank remains cautious regarding rate cutting. Out of the major economies fighting inflation right now, the UK is predicted to cut rates last as inflation there has been rampant. Germany is mired in a recession largely driven by manufacturing activity. The rest of Europe looked to be in better shape but recently had a surprise inflation spike of 2.9%, tempering expectations of an earlier-than-expected rate cut.
In the 4th Quarter, the MSCI EAFE Index, representing developed international markets, also rallied with other developed markets, but lagged the performance in North America.
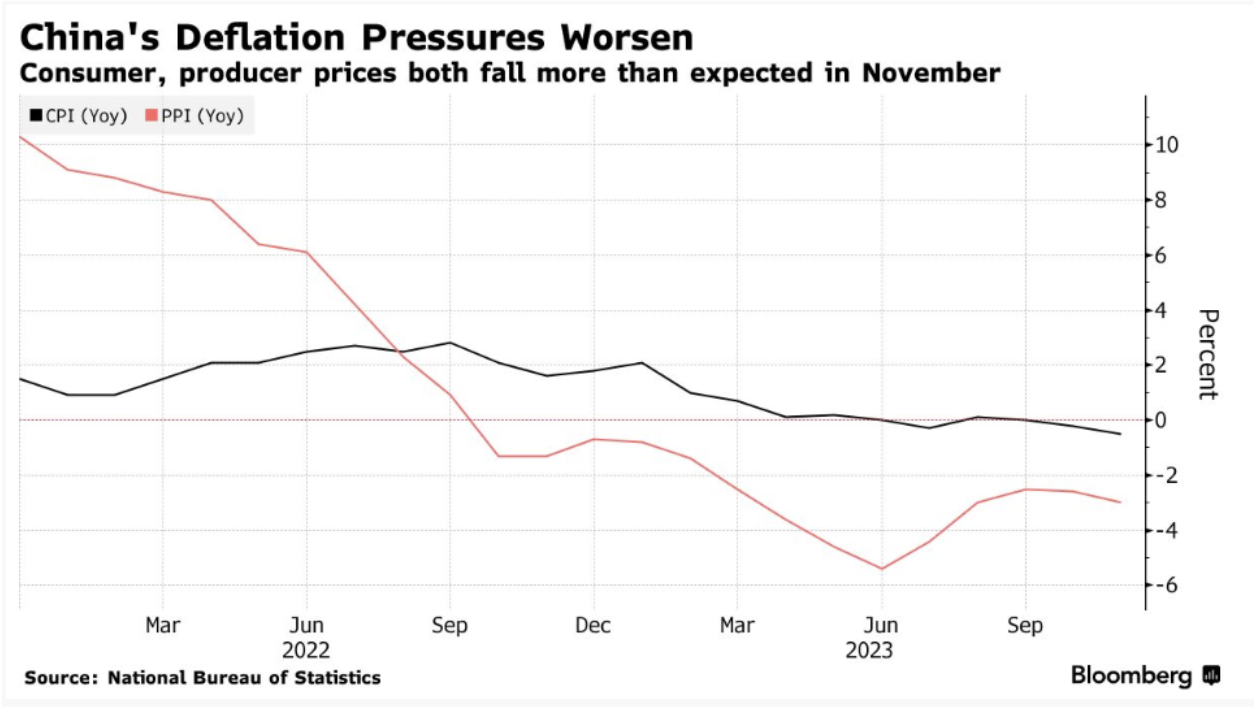
It was a good quarter for emerging markets, with one giant exception, : China. Large Cap Chinese equities continued their slide, down almost -10% this last quarter. A lack of global export demand has severely hurt their domestic consumers, leading to a significant real estate crisis spilling into their financial sector. The government claims its focus is to support its manufacturing sector, but that, too, is a problem as its debt level has risen considerably in this effort. Unlike most of the world, China is experiencing deflationary pressure, which dramatically increases its real cost of borrowing on that debt. China’s struggling economy has scared off foreign investment this year, which is sitting on the sidelines, waiting for a plan from China’s central government to do enough for them to start calling a bottom.
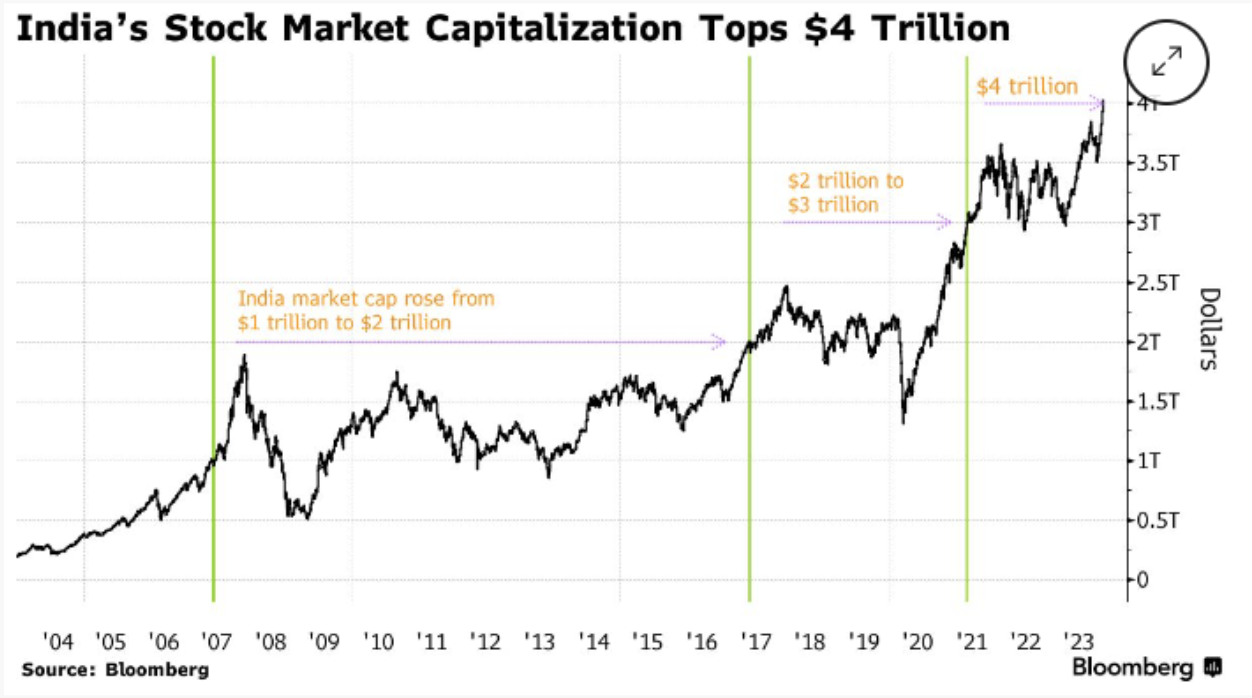
On the opposite side of the spectrum (and Himalayan mountains) sits India, whose equity market just surpassed the 4 trillion mark, showing signs that its economy is likely developing into something like the hyper-growth China of decades ago. India enters an election year in 2024, and all eyes will be on Modi to see if he can retain his majority.
Portfolio Attribution & Positioning
Growth Portfolio:
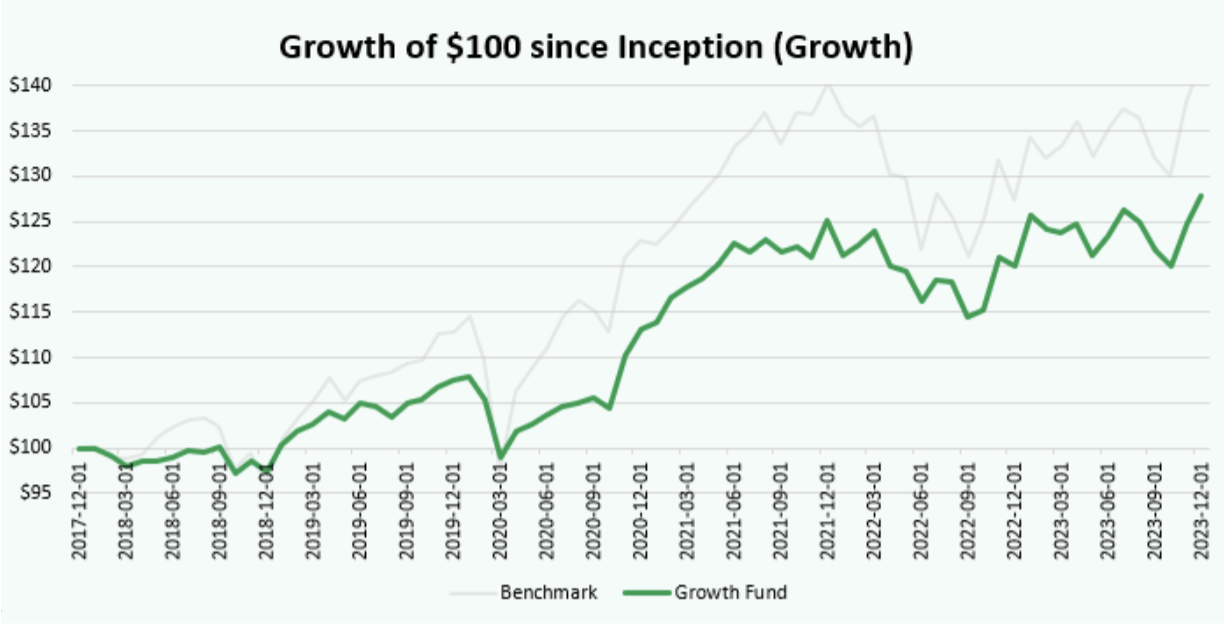
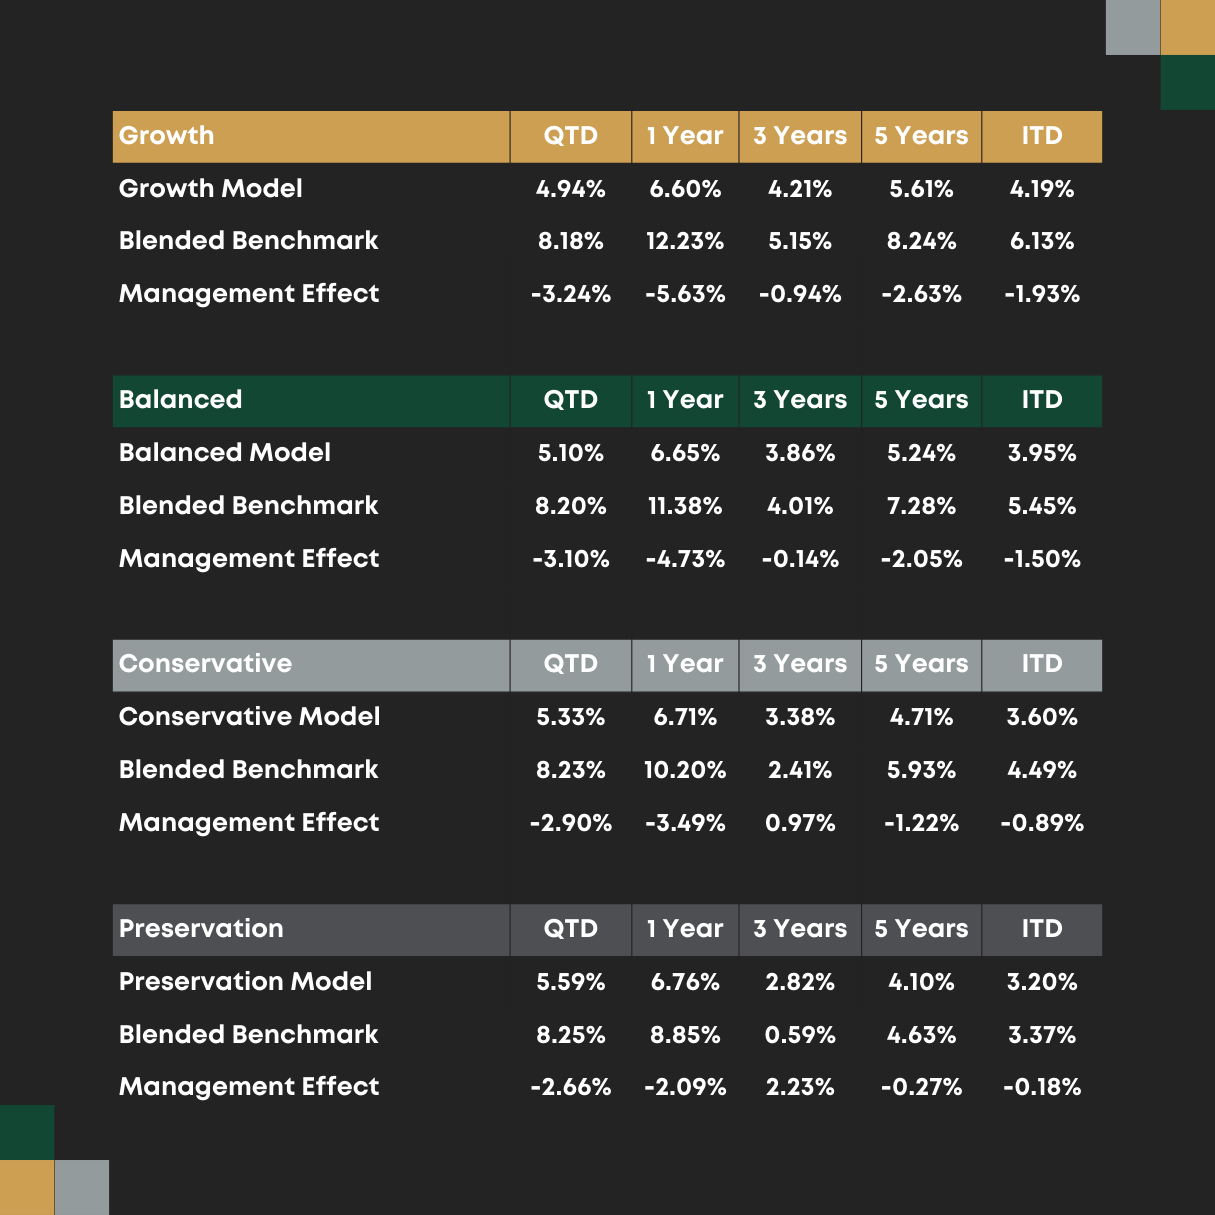
Our top-performing investments this quarter came from equity and fixed income. Stocks saw similar results regardless of geography, sector, or market capitalization, all within a narrow range of 7.25% to 9.2%, with the exception being emerging markets, 3.05%, which China weighed heavily on. Small-cap strategies in both Canada and the US performed particularly strongly in the November and December equity rallies. Bonds had a similarly good quarter, but with a broader variance, 3.35% to 12.15%, with the long-duration bonds outperforming the shorter ones. Preferred Shares had a solid November (up 9.17%) but were up 5.85% overall for the quarter.
Our newly subscribed Private Credit investments and our market-neutral investments were dragging on performance for the quarter. Our US Private credit investments were down a couple of percent due to a decline in the US/CAD (the greenback did not have a good Q4 relative to the CAD, down -3.64%). Though conventional fixed income performed well in the quarter, we maintain that Private Credit will deliver consistent returns in the 10% range. There is also a lagged performance effect of holding private credit in that many of the fund’s report performance after a month or quarter end, which is picked up in the following period.
Market neutral (or hedged strategies) were generally positive for the quarter but lagged the equity rally. The recently added Vision hedged real estate strategy was up about 7% in the first two months of our holdings. Polar and AQR performance was positive but more muted. Polar Multi-Strategy did 1.75% for the quarter, whereas the Long Short fund did 2.34%. AQR was a positive 1.2% in the first month of holding it.
In Q4, we made the following changes to the Growth Portfolio:
Increases:
- Private Credit
- Real Estate
- Long/Short
- Multi-Strategy
Decreases:
- Canadian Equity
- ETF Growth
- US Equity
- Cash
- Emerging Market Equity
In Q4, our Investment Committee was very active in adding new managers and strategies, including additional Private Credit (Morgan Stanley, Carlyle, Blackstone and SAF/AGF), a new market-neutral manager (AQR), and an allocation to a hedged public real estate manager (Vision Capital). We still believe that the premium for holding long equity over other securities with less risk is at a multi-decade low after the substantial rise in interest rates in 2022 and 2023. Our Growth Fund holdings reflect this while still allowing us to participate in future appreciation in equities. We have reduced our cash position now that there’s slightly more macroeconomic clarity and more attractive opportunities that we feel can outperform cash on a risk-adjusted basis.
Preservation Portfolio:
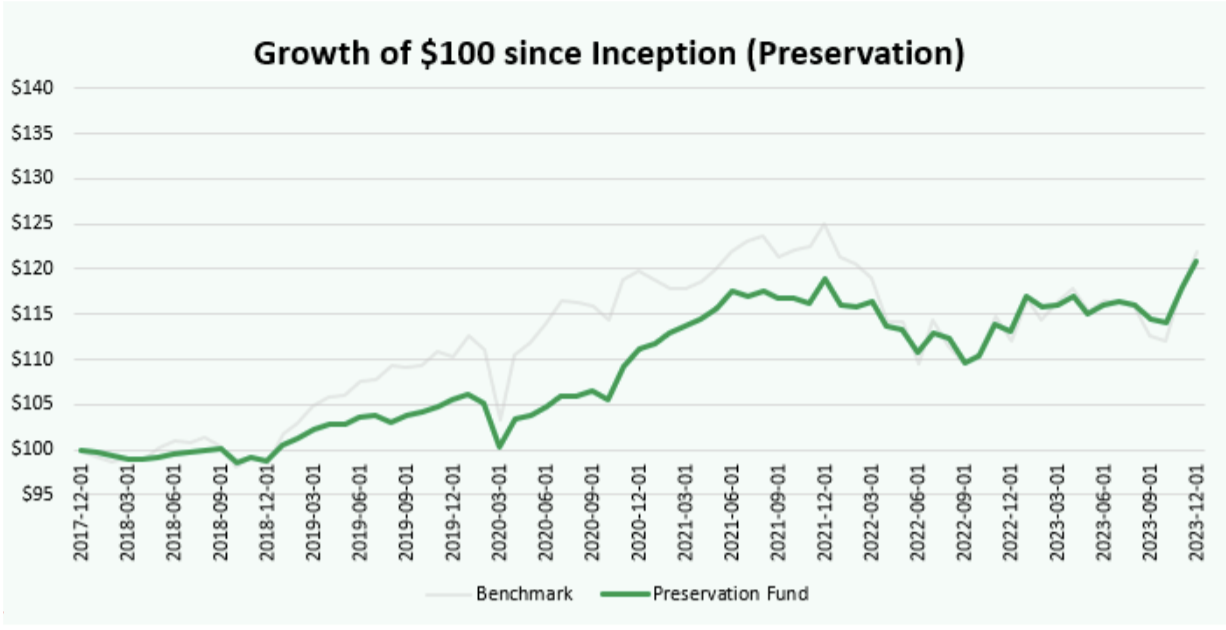
Our Preservation Fund delivered a respectable 5.59% for the quarter. This is a result of the strong performance of the bond market to the end of the year, as our preservation fund was increasingly weighted more and more throughout the year towards fixed income as the risk premium from equities continued to evaporate. Even though we increased the duration of our bond funds this quarter, it wasn’t enough to keep up with the 12 percent gains seen on the long end of the curve.
As we advance, we are more than satisfied to hold much more fixed income than equities in this fund for the foreseeable future. If interest rates are indeed coming down this year, central banks have almost put a put (safety net) on the bond market. Barring any surprises, not that we don’t expect any, fixed income should perform very well in 2024.
We made the following changes in Q4:
Increases:
- Long-Term Bonds
- Corporate Bonds
Decreases:
- International Equities
- Short-Term Bonds
- Cash
- Emerging Markets
- ETF Growth
- US Equity
The Investment Committee decided to increase our bond duration this quarter by adding a long-term bond fund and increasing our corporate bond allocation with proceeds from the sale of some of our equities and short-term bond allocation. We also reduced our cash position.
Year-to-Date Performance & Outlook
The pace at which market sentiment changed from “higher for longer” in the early fall to Fed Pivot by late fall caught many pundits by surprise. All major asset classes saw the biggest one-day gain since 2009. The market saw positive performance across almost all asset classes, and correlations were very high between asset classes. This worked against so many of our diversifying strategies, like our tactical and absolute strategies, which saw positive but more muted returns. Throughout the year, we added to more aggressive positioning, which we viewed would benefit eventual interest rate declines but did not. Still, we did not anticipate the pace at which the market would move. It appears that the market is overbought, and we were not surprised to see the rally end in the first week of 2024.
Our highly diversified portfolios offered considerably lower volatility compared to the market. We missed out on some of the fantastic performance performances of the Magnificent 7, which currently trades at a PE ratio of 28. As value investors, it’s difficult for our model to own these stocks in the proportions currently weighted within the S&P 500. Our model and long equity asset allocation are set using the Cyclically Adjusted Price Earnings Ratio (CAPE). As the chart below shows, many regions have drifted closer to longer-term averages (or even below). Meanwhile, the US saw its CAPE ratio revert closer to all-time highs, historically predicting much lower returns in the subsequent 10 years.
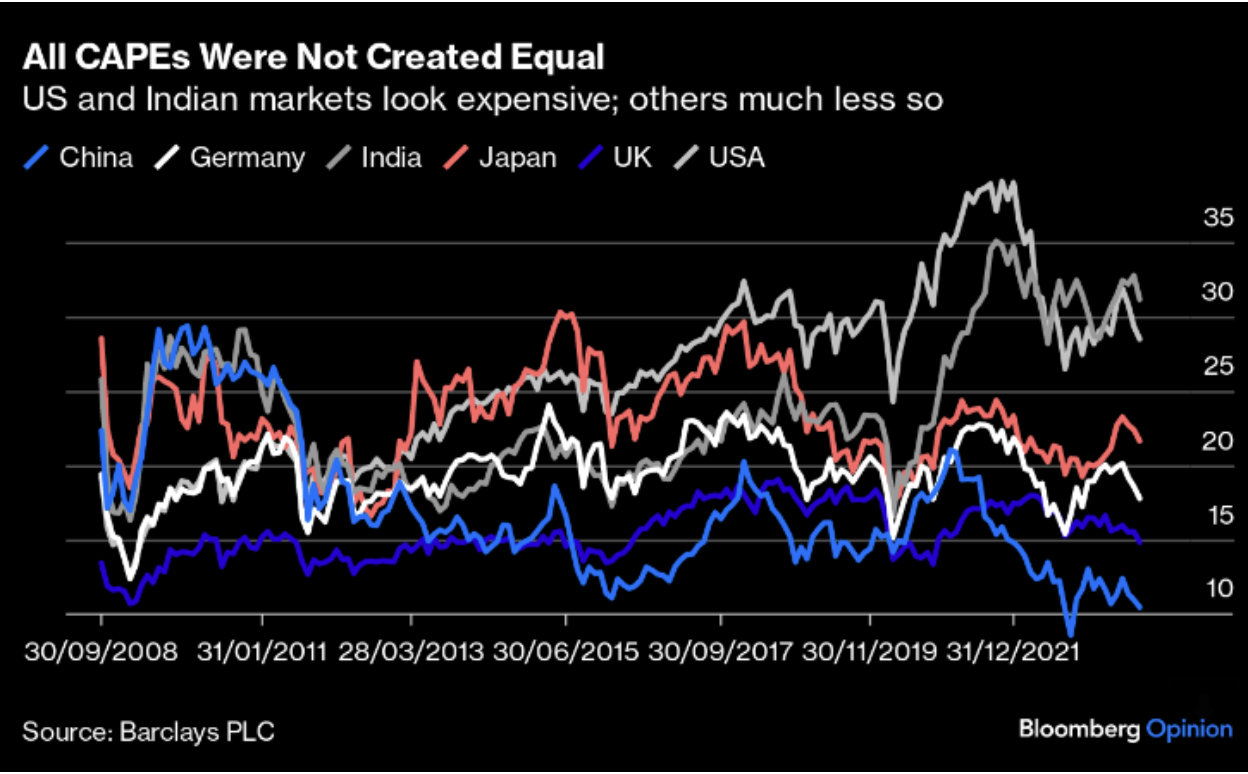
The above chart shows the CAPE of several large equity markets. As you can see, the US and India have very elevated figures, whereas China and the UK have historically low CAPE ratios. This reflects the price the market is willing to pay for future cashflows with a high likelihood of occurring. Given the weight that the US mega-cap stocks carry on the indexes that comprise our benchmarks and the tremendous year they just had, it’s challenging to match that performance, and frankly, we don’t expect to.
Our market outlook continues to grow in optimism as the prospect of interest rate reductions grows, and the economic picture reflects higher probabilities of a softer landing than many expected heading into 2023. That said, there is still some probability that rate cuts will occur because of a weaker economic outlook, which could drag on earnings and, thus, equity valuations. This year, we entered the year cautiously optimistic, whereas our outlook for 2024 might be characterized as moderately optimistic. We have taken several steps this year to enhance the expected return profile of the funds, particularly adding strategies to the funds that we believe will provide more consistent positive returns.
